Market Volatility And Investor Behavior: A Look At The Recent Crash

Table of Contents
Understanding Market Volatility
Market volatility refers to the rate and extent of changes in market prices. High volatility signifies rapid and substantial price swings, while low volatility suggests more stable prices. Several factors contribute to market volatility. These include:
- Economic Indicators: Fluctuations in key economic indicators like inflation, interest rates, and GDP growth significantly influence investor confidence and market sentiment. High inflation, rising interest rates, or slowing GDP growth often lead to increased market volatility.
- Geopolitical Events: Global political events, such as wars, trade disputes, and political instability, can create uncertainty and trigger dramatic market reactions. Unexpected geopolitical shifts often result in sharp increases in market volatility.
- Investor Sentiment: Market psychology plays a crucial role. Periods of optimism can lead to inflated valuations and increased risk-taking, while fear and pessimism can trigger sharp sell-offs and increased market volatility. News, social media trends, and overall market perception significantly influence investor sentiment and, consequently, volatility.
Market volatility can be categorized into short-term and long-term variations:
- Short-term volatility: This refers to daily or weekly price fluctuations. It's often driven by news events, speculation, and short-term trading strategies.
- Long-term volatility: This involves price swings over months or years. It's usually influenced by broader economic trends and fundamental shifts in the market. Long-term market volatility is generally less pronounced than short-term volatility but can have more significant long-term consequences.
Measuring market volatility often involves using metrics like:
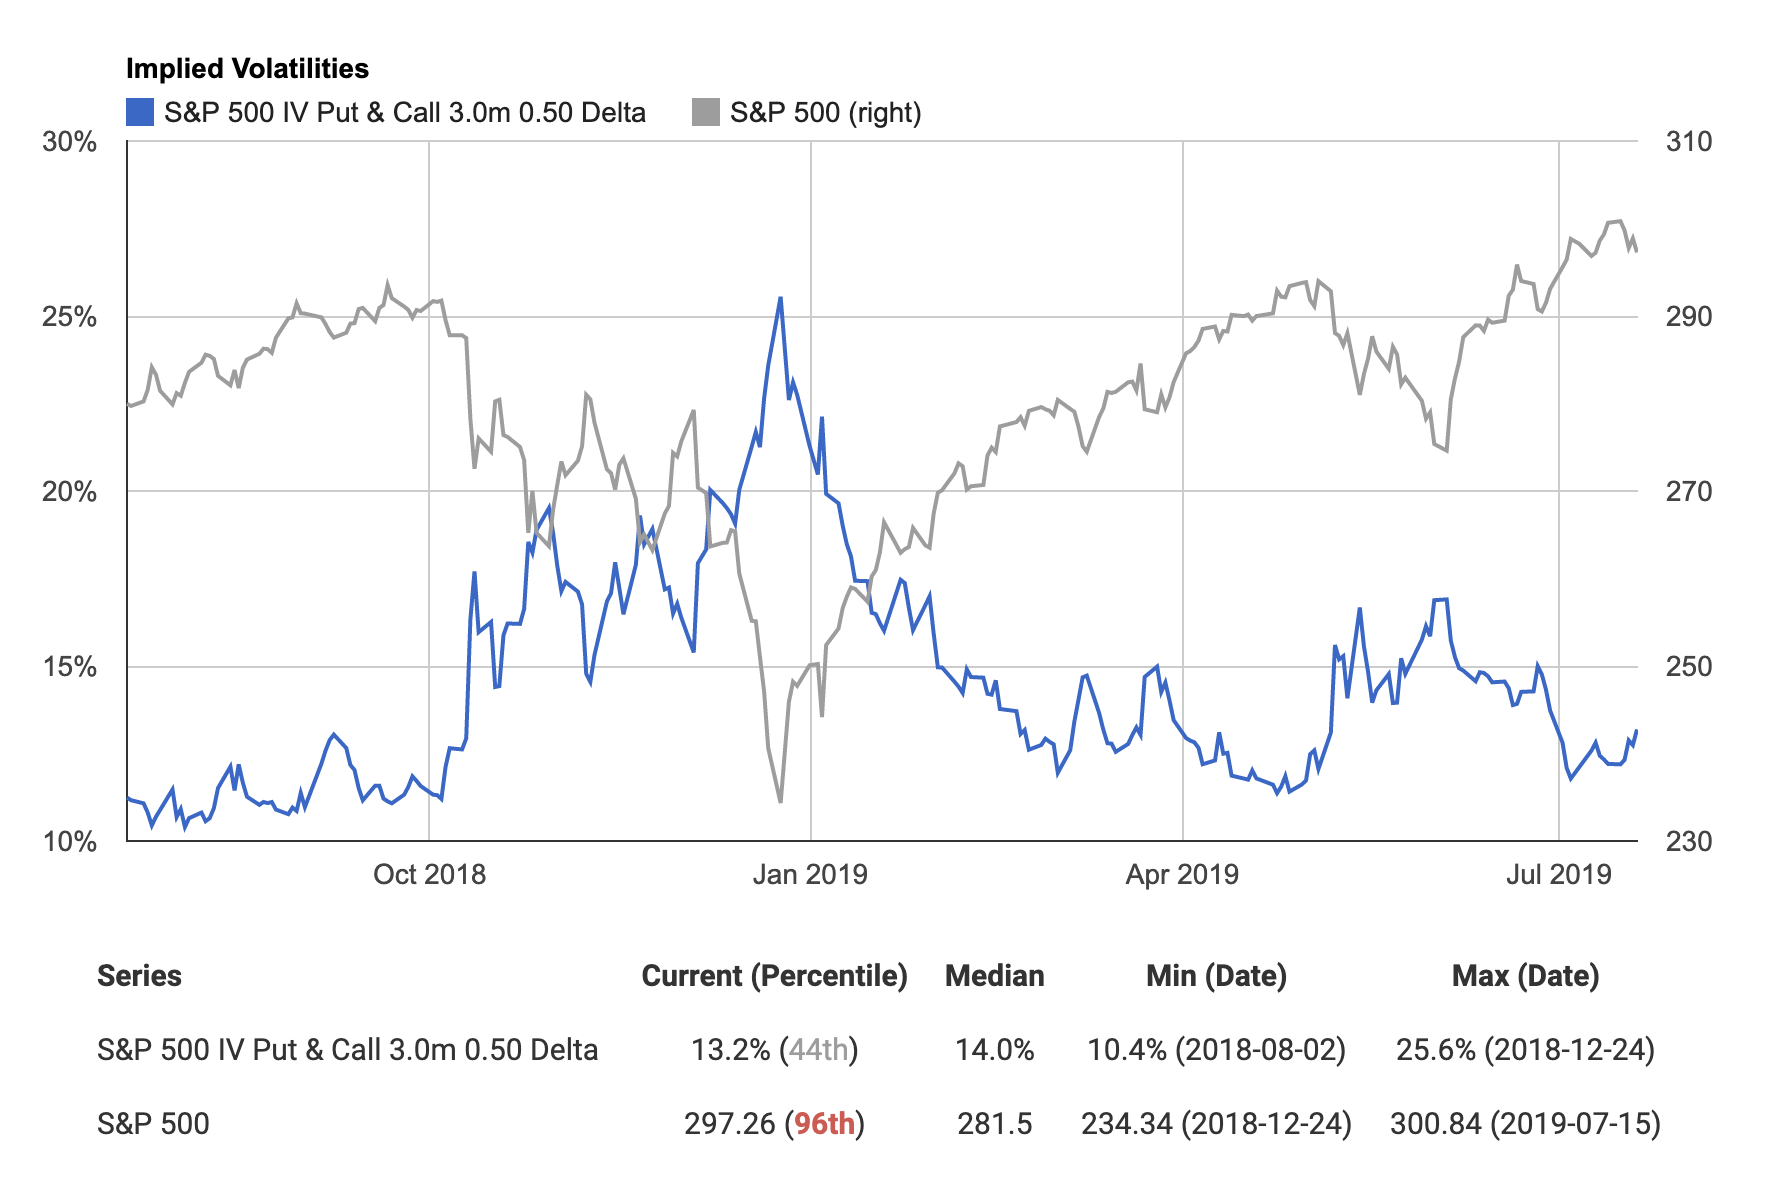
- VIX Index (Volatility Index): This index, often called the "fear gauge," measures the implied volatility of S&P 500 index options. A higher VIX suggests greater expected market volatility.
- Beta: This metric measures a stock's price volatility relative to the overall market. A beta greater than 1 indicates higher volatility than the market, while a beta less than 1 suggests lower volatility.
Investor Behavior During Periods of Volatility
Fear and Panic Selling
Market drops can trigger powerful psychological responses, leading to fear and panic selling.
- Herd mentality: Investors often mimic the actions of others, leading to a cascade effect where widespread selling amplifies market declines.
- Fear-driven decisions: Fear can cloud judgment, causing investors to make irrational decisions based on emotion rather than rational analysis.
- Examples: The recent crash saw numerous examples of panic selling, with investors rushing to liquidate their holdings regardless of the underlying value of their assets.
Risk Aversion and Portfolio Adjustments
Increased market volatility often prompts investors to become more risk-averse.
- Risk mitigation strategies: Investors may diversify their portfolios, reduce their exposure to equities, or employ hedging strategies to protect against losses.
- Impact on market liquidity: A surge in risk aversion can decrease market liquidity as investors seek to sell assets, potentially exacerbating price declines.
- Examples: During the recent crash, many investors shifted towards safer assets like government bonds and cash, reducing their holdings in riskier equities.
Opportunistic Buying
Contrarian investors view market downturns as opportunities to acquire undervalued assets.
- Value investing: This strategy focuses on identifying companies trading below their intrinsic value. Market volatility can create opportunities to buy such companies at discounted prices.
- Identifying undervalued assets: This requires thorough fundamental analysis and a long-term perspective.
- Long-term strategies: Successful opportunistic buying requires a long-term investment horizon, allowing time for undervalued assets to appreciate.
The Recent Crash: A Case Study
The recent market crash was triggered by a confluence of factors, including [insert specific events, e.g., rising interest rates, geopolitical tensions, inflation concerns]. [Insert analysis of market performance during the crash, possibly including charts and graphs showing key market indices]. The period demonstrated a wide range of investor behaviors, from widespread panic selling to opportunistic buying by contrarian investors. Many investors reacted emotionally, while others strategically adjusted their portfolios to weather the storm.
Conclusion
Market volatility is an inherent part of investing, and the recent crash serves as a stark reminder of its unpredictable nature. Understanding investor behavior during periods of heightened volatility is key to developing effective investment strategies. By acknowledging the psychological impact of market fluctuations and adopting a balanced approach that incorporates risk mitigation and opportunistic buying, investors can navigate market volatility more effectively. Remember that understanding and managing market volatility is a continuous process, requiring ongoing learning and adaptation. Learn to identify signs of increasing market volatility and develop a robust investment strategy to protect your portfolio. Don't let the fear of market volatility paralyze you – learn to manage it and prosper.

Featured Posts
-
 The U S Dollars Potential For A Historic First 100 Days Under The Current Presidency
Apr 28, 2025
 -
 New York Yankees Aaron Judge Becomes A Father
Apr 28, 2025
 -
 Jan 6th Falsehoods Ray Epps Defamation Case Against Fox News Explained
Apr 28, 2025
 -
 Evaluating Pitchers Name S Case For A Mets Rotation Spot
Apr 28, 2025
 -
 Monstrous Beauty Challenging Traditional Views Of Chinoiserie At The Metropolitan Museum
Apr 28, 2025
